A work breakdown structure (WBS) is a deliverable-oriented
grouping of the work involved in a project that defines the total scope of the
project.
The WBS is a document that breaks all the work required for the
project into discrete tasks, and groups those tasks into a logical hierarchy. The
Work Breakdown Structure provides a structural view into the project. It is an
essential tool for planning and executing the project.
There are three reasons to use a WBS in your
projects. The first is that is helps more accurately and specifically define
and organize the scope of the total project. The most common way this is done
is by using a hierarchical tree structure. Each level of this structure breaks
the project deliverables or objectives down to more specific and measurable
chunks. The second reason for using a WBS in your projects is to help with
assigning responsibilities, resource allocation, monitoring the project, and
controlling the project. The WBS makes the deliverables more precise and
concrete so that the project team knows exactly what has to be accomplished
within each deliverable. This also allows for better estimating of cost, risk,
and time because you can work from the smaller tasks back up to the level of
the entire project. Finally, it allows you double check all the deliverables’
specifics with the stakeholders and make sure there is nothing missing or
overlapping.
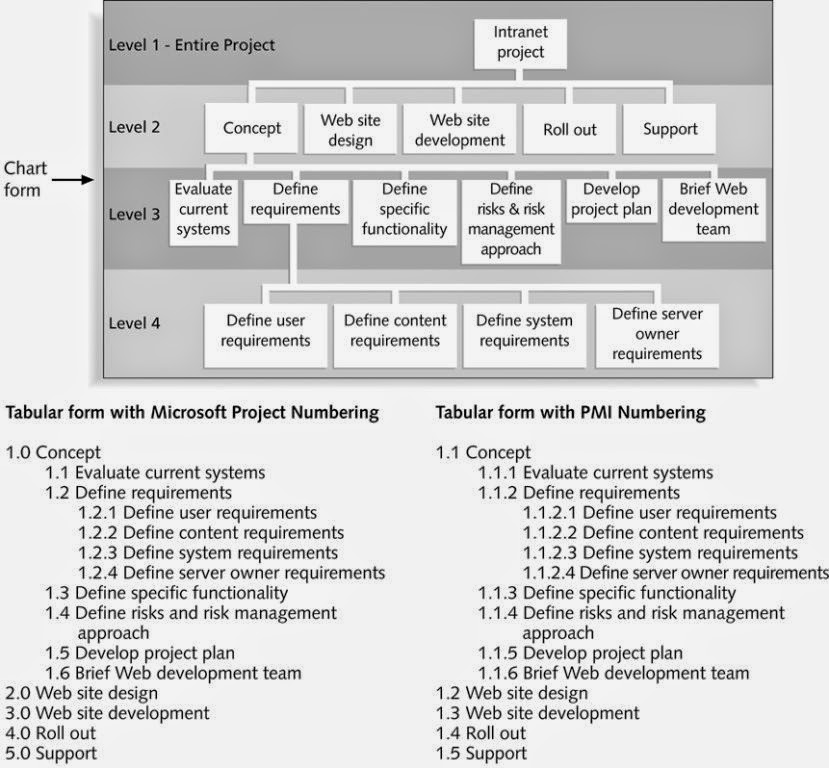
WBS is often shown in two different forms:
— Graphical or chart form
— Tabular or list form
Hierarchical Structure (tabular)
|
Level
|
WBS Code
|
Element Name
|
|
1
|
1
|
Widget Management System
|
|
2
|
1.1
|
Initiation
|
|
3
|
1.1.1
|
Evaluation &
Recommendations
|
|
3
|
1.1.2
|
Develop Project Charter
|
|
3
|
1.1.3
|
Deliverable: Submit Project
Charter
|
|
3
|
1.1.4
|
Project Sponsor Reviews
Project Charter
|
|
3
|
1.1.5
|
Project Charter
Signed/Approved
|
|
2
|
1.2
|
Planning
|
|
3
|
1.2.1
|
Create Preliminary Scope
Statement
|
|
3
|
1.2.2
|
Determine Project Team
|
|
3
|
1.2.3
|
Project Team Kickoff Meeting
|
|
3
|
1.2.4
|
Develop Project Plan
|
|
3
|
1.2.5
|
Submit Project Plan
|
|
3
|
1.2.6
|
Milestone: Project Plan
Approval
|
|
2
|
1.3
|
Execution
|
|
3
|
1.3.1
|
Project Kickoff Meeting
|
|
3
|
1.3.2
|
Verify & Validate User
Requirements
|
|
3
|
1.3.3
|
Design System
|
|
3
|
1.3.4
|
Procure Hardware/Software
|
|
3
|
1.3.5
|
Install Development System
|
|
3
|
1.3.6
|
Testing Phase
|
|
3
|
1.3.7
|
Install Live System
|
|
3
|
1.3.8
|
User Training
|
|
3
|
1.3.9
|
Go Live
|
|
2
|
1.4
|
Control
|
|
3
|
1.4.1
|
Project Management
|
|
3
|
1.4.2
|
Project Status Meetings
|
|
3
|
1.4.3
|
Risk Management
|
|
3
|
1.4.4
|
Update Project Management Plan
|
|
2
|
1.5
|
Closeout
|
|
3
|
1.5.1
|
Audit Procurement
|
|
3
|
1.5.2
|
Document Lessons Learned
|
|
3
|
1.5.3
|
Update Files/Records
|
|
3
|
1.5.4
|
Gain Formal Acceptance
|
|
3
|
1.5.5
|
Archive Files/Documents
|
Building WBS
The analogy approach: Review WBSs of similar projects and tailor to your project
The top-down approach: Start with the largest items of the project and break them
down
The bottom-up approach: Start with the specific tasks and roll them up
Mind-mapping approach: Mind mapping is a
technique that uses branches radiating out from a core idea to structure
thoughts and ideas
Considerations When Building a Work Breakdown Structure
As you set up your project WBS,
think about how you will want to use it later in the project. For instance, pay
close attention to the indents in your WBS because these eventually end up
being the indent structure in your Gantt schedule. Intuitively we gravitate
toward developing task-oriented work breakdown structures because they are easy
to understand, and because we tend to think of a project as a collection of
tasks. It usually takes more effort to develop a deliverable-oriented WBS
because they include multiple levels of detail. Yet, taking the time to develop
a deliverable-oriented WBS may better serve the project, especially if
extensive project management controls are used. Determine whether you want to
build a WBS that is process oriented or product oriented. What’s the
difference? If the results you want from your project can be defined in verbs,
then you want a WBS that is process oriented. If you want a WBS that is built
on nouns, then it will be product oriented. Remember that our brains can
simultaneously comprehend only 7 to 9 items at a time. When a project involves
hundreds of tasks, they need to be broken into chunks that we can readily
understand and use. The process of creating a WBS helps break down the project,
which makes it easier to manage – and master. Be sure there is no overlap in
scope definition between two elements of your WBS. Not only would this result
in duplication of effort, but would likely cause confusion regarding
responsibility, authority and cost accounting. To help alleviate this problem,
create a WBS dictionary to describe each component in detail.
The Building Process
Not only do you need the project
scope to create your WBS, you need the input from the project managers and team
leaders. Generally, the WBS-building process finds all these people in a room
with plenty of white boards and markers, or pads of paper and sticky notes. Out
of this brainstorm session should come a first draft of the project WBS. It
should be one that will foster “buy in” because the core project personnel
participated in its development.
Creating a quality WBS can take
a substantial amount of time, but is usually worth the effort because of the
additional clarity it provides for the project manager.
The first step to creating your WBS is to get all your team, and
possibly key stakeholders, together in one room. Although your team is not
listed as an input or tool in the above sections, they are probably your most
vital asset to this process. Your team possesses all the expertise, experience,
and creative thinking that will be needed to get down to the specifics of each
deliverable. Next, we have to get the first two levels setup. The first level
is the project title, and the second level is made up of all the deliverables
for the project. At this stage it is important to function under the 100% Rule.
This rule basically states that the WBS (specifically the first two levels)
includes 100% of all the work defined in the project scope statement and
management plan. Also, it must capture 100% of all the deliverables for the
project including internal, external, and interim. In reality the WBS usually
only captures between 90-95%, and 100% is our goal.
Once we have gotten the first two levels set, it is time to
launch into our decomposition. Decomposition is the act of breaking down
deliverables in to successively smaller chunks of work to be completed in order
to achieve a level of work that can be both realistically managed by the
project manager and completed within a given time frame by one or more team
members. This level of breakdown and detail is called the work package. Work
packages are the lowest level of the WBS and are pieces of work that are
specifically assigned to one person or one team of people to be completed. This
is also the level at which the project manager has to monitor all project work.
Now the million dollar question is how specific and small does a chunk of work
need to be to still be considered a work package? Well PMBOK does not seem to
give a definitive answer on that. Most project managers concur that this varies
by project, but can usually be measured using the 8/80 Rule. The 8/80 Rule says
that no work package should be less than 8 hours or greater than 80 hours.
Notice we said that the work package is the lowest level of the WBS. Activities
and tasks are not included in the WBS. They will be planned from the work
packages once they are assigned.
Now you are ready to start your team on the work of
decomposition, but do not get too far ahead of yourself quite yet. As grandpa
always said "There is no reason to reinvent the wheel." Occasionally,
you will run into a project that is a "first of its kind," but that
is not usually the case. Most of the time, you, your team, or your organization
has done a project like this one in the past. That means that there should be a
WBS from the previous project that you can use as a template. This will save
you a lot time and effort. Even if you have not done a project like this one
before, most Project Management Offices (PMOs) have basic WBS templates that
can get you started. Another great technique to make your life easier is the
Post-It Note Technique. I know it sounds a little cheesy, but it actually works
very well. In this technique you simply write each deliverable on a post-it
note and stick them at the top of a wall. Then you and your team start to break
down each deliverable into components and write each component on its own
post-it note. This way, as you place them on the wall and start to create your
tree structure, everyone can easily see what has been accomplished and where
you are headed. Also this technique allows for easy movement of components
around within the WBS.
Also, when creating the WBS for very large, lengthy, or complex
projects, all the deliverables' specifics might not be known up front and,
therefore, it is difficult to create a full WBS. In cases such as these many
people use what is called Rolling Wave Planning. This is when you plan down to
the level of detail currently known and go back to plan deeper once more
information is acquired. Usually rolling wave planning needs to stay as least
2-3 months ahead of the actual work being done, but of course this varies
slightly by industry.
Lastly let's look at five common pitfalls to creating a WBS. If
you can keep these few possible issues in mind when you are creating your WBS,
you and your team will be much more successful at creating a useful and
accurate Work Breakdown Structure.
1. Level of Work Package Detail
When deciding how specific and detailed to make your work
packages, you must be careful to not get too detailed. This will lead to the
project manager to have to micromanage the project and eventually slow down
project progress. On the other hand, work packages whose details are too broad
or large become impossible for the project manager to manage as a whole.
2. Deliverables Not Activities
or Tasks
The WBS should contain a list of broken down deliverables. In
other words, what the customer/stakeholder will get when the project is
complete. It is NOT a list of specific activities and tasks used to accomplish
the deliverables. How the work is completed (tasks and activities) can vary and
change throughout the project, but deliverables cannot without a change request,
so you do not want to list activities and tasks in the WBS.
3. WBS is not a Plan or Schedule
The WBS cannot be used as a replacement for the project plan or
schedule. A WBS is not required to be created in any type of order or sequence.
It is simply a visual breakdown of deliverables.
4. WBS Updates Require Change
Control
The WBS is a formal project document, and any changes to it
require the use of the project change control process. Any changes to the WBS
change the deliverables and, therefore, the scope of the project. This is an
important point to help control scope creep.
5. WBS is not an Organisational
Hierarchy
The WBS and Organisational Hierarchy chart are never the same
thing. Although often similar in appearance, these two documents are very
different. The Organisational Hierarchy shows things like chain of command and
lines of communication, but the WBS is restricted simply to a project and shows
only the deliverables and scope of that project.
We hope that this article has helped you better understand the
Work Breakdown Structure's purpose, process, and common pitfalls. The WBS is an
extremely valuable tool to the project management methodology. It can make or
break a project. It sets the foundation for the rest of the project planning. A
solid WBS helps ensure proper project baselines, estimating, resource use,
scheduling, risk analysis, and procurement.
References:
IS 445/645-Introduction to Project
Management

